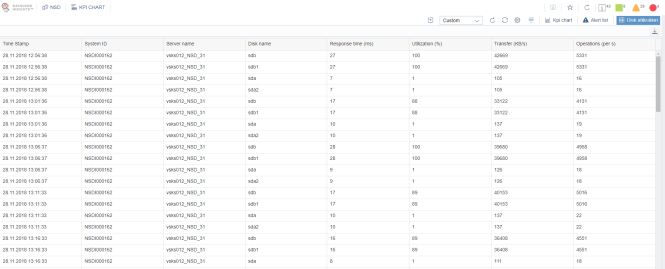
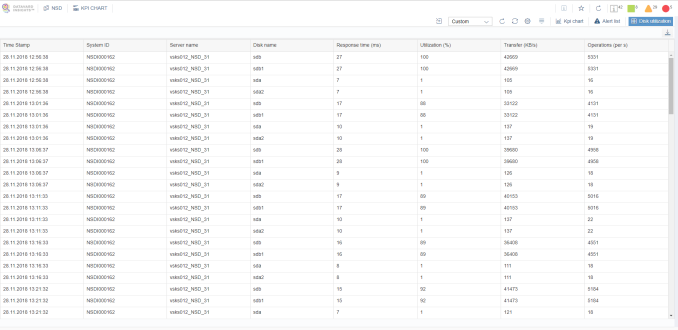
Detail Tables
The last tab is displayed if the selected KPIs are assigned to detail tables. Each detail table creates a new tab with a corresponding name, for example regarding disk utilization.
Date/Time Range Selection
In this toolbar, you can select a date/time period for the chart and detail tables. All monitoring data in the window is displayed for the selected period only.
You can choose predefined values such as Hour or Day, or you can define any desired date range via the Custom option. If you select Hour, for example, the range will be calculated and applied.
To refresh or change the date range, click Refresh, select another time period or refresh the page in your browser. There is also an auto-refresh function, which is enabled by default. You can turn enable or disable it via the Auto-refresh option.
You can click Settings to change the auto-refresh period or the periods of the date/time navigation arrows. These arrows increase or decrease the date/time value.

Actions
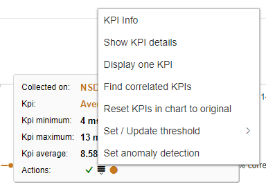
The KPI chart tab provides two ways to select the displayed actions:
-
By clicking
 Action.
-
By clicking any point on the selected chart line and selecting Action.
The following actions are displayed:
To perform certain actions, you must first select a KPI as a parameter. If you access the action menu from a point on the chart or from the legend, this KPI parameter is taken from the data you have clicked.
Action Descriptions
KPI Info
This action shows additional information about the selected KPI such as the Technical name, Description, Unit and Long description.
Show KPI Details
This action redirects you to detailed information in a detail table. You can use this action for any KPI that is displayed in a chart and is linked to a detail table.
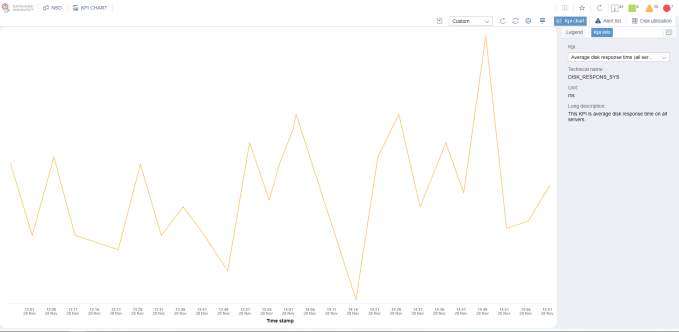
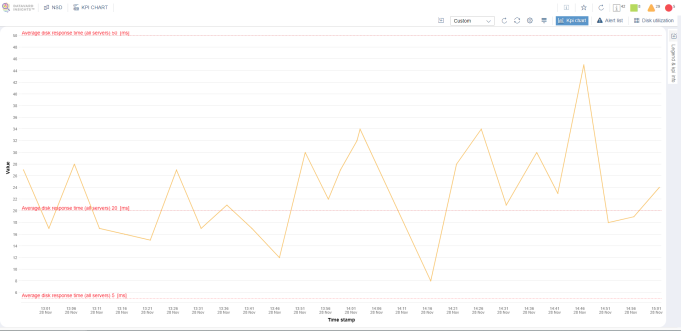
Display One KPI
This action shows the selected KPI in the chart. When you choose to display only one KPI in a chart, the following additional information is displayed: The Y-axis will contain values and alert thresholds (dash-dotted line) for the selected KPI and system.
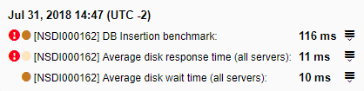
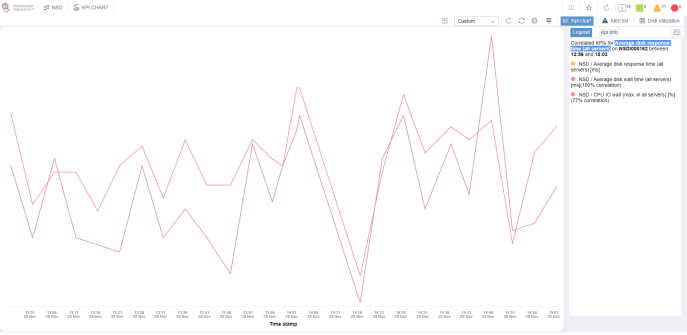
Find Correlated KPIs
You can use this action to find KPIs that correlate with the selected KPI within the chosen time range. KPIs with a correlation coefficient greater than or equal to 70% are displayed.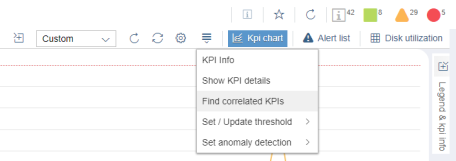
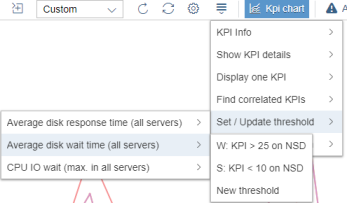
Example of a correlated KPI called Average disk response time (all servers):
Set / Update Threshold
After clicking this action, you must first select a KPI. Then you can create a new alert threshold or update an existing one.
After selecting one option, a form is displayed, where you can define the conditions based on which the alert occurs.
In the Advanced Options area, you can define additional parameters.
In the Set Notifications area, you can add, remove or change the notifications for an alert.
Set Anomaly Detection
Anomaly detection is another way to monitor KPI behavior. It checks whether KPI values are not behaving in the usual way. After you select a KPI, you can add or change the anomaly settings.